In this article we introduce a scaleable solution designed to track and report regional-scale forest harvesting. The spatial layers produced are summarised to an online dashboard in a format that provides information on where and how much area has been harvested over time. The advantage of the solution is that the process can be re-run to provide near-real-time information to support a range of environmental planning and strategic decision-making processes.
While high revisit satellite data is readily available and appropriate for such applications it is often difficult to cope with the volumes of data, filter and interpret changes in a structured way.
Indufor’s monitoring system presents a rapid, scalable approach that mitigates these bottlenecks. The process begins by subdividing the monitoring area into hexagons, each is checked for the presence of forest, then actively monitored for change using the five daily Sentinel-2 imagery. When a significant and sustained change occurs within the unit, an alert is generated, and an interactive online dashboard is updated to reflect the change. Examples of changes that will trigger alerts include harvesting, bushfires, windthrow and significant drought stress.
This process allows the process of large-scale asset monitoring to be streamlined, eliminating the need for cumbersome manual image search and analysis. Over defined areas, these routines track land cover changes and generate alerts that assist in identifying the date of change and its progression. By generating unique collections of images and applying cloud and cloud shadow masking to every image, the monitoring system makes the most of the imagery which is available, allowing it to be used effectively in locations where estate wide cloud-free scenes may be rare and avoiding false-positive alerts. A classification pass is also used to remove grids that predominately contain bare ground using summer imagery from the previous year, further reducing the prevalence of spurious alerts.
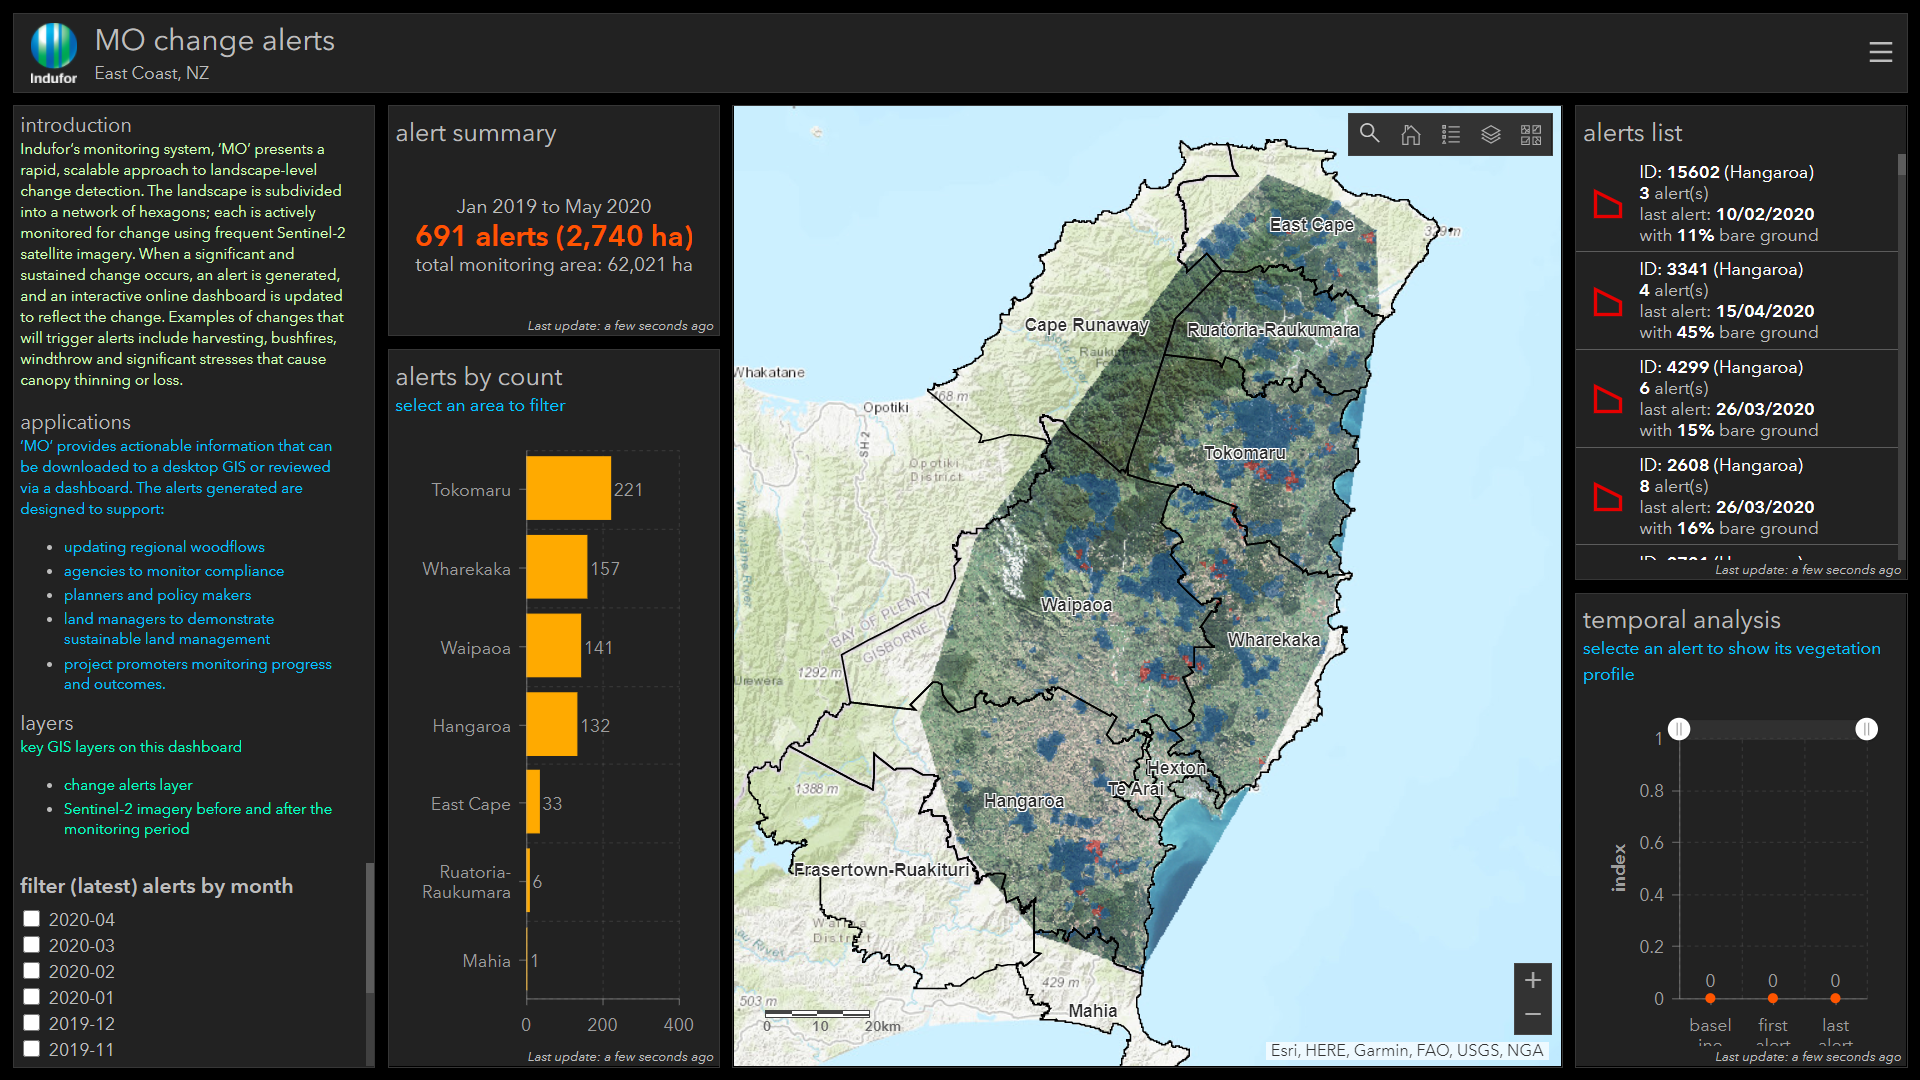
The following dashboard shows an example of this process run over a subset of New Zealand’s East Coast. The monitoring area comprises of 15,800 hexagon units covering some 62,000 ha and spans from January 2019 to April 2020, with May to October excluded to avoid spurious results due to the topographic shadow that occurs with low winter sun angle in this hilly region. Grids returning alerts within the monitoring period are listed in the alerts list on the dashboard – query them to visualise a vegetation index trend and its attributes, including the date at which the alert was recorded.
The monitoring framework demonstrated in this example utilises Indufor’s Continuous Monitoring System.
Click here or the image below to access the interactive dashboard (recommend using a tablet or larger device).