The past 50 years have seen rapid changes across landscapes, with forests and wetlands alike converted for agricultural use or, conversely, re-afforested due to policy or economic drivers. While official land use maps often exist, they only provide a static, point in time snapshot that quickly becomes dated. This limits their use for agencies responsible for environmental monitoring and protection in near real-time applications.
The recently completed EnviroSatTools project filled this gap by developing a collaborative satellite data workspace with regional councils. Over two years, the project consortium led by Dr Rogier Westerhoff of GNS Science developed targeted modules to support regional councils in monitoring processes, including land-use change, wetland and flood plain dynamics. Click here to hear Dr Westerhoff discussing the project outcomes with the council’s scientists.
As a collaborative project, importance was placed on data accessibility, processing capacity and ease of data sharing and knowledge. The project adopted Google’s open access cloud-computing platform Google Earth Engine (GEE). The GEE framework stores satellite data in the cloud and creates an environment that allows the joint development of processing routines (scripts) and applications accessed through a web browser.
Indufor’s resource monitoring team, led by Dr Pete Watt, was responsible for developing the forest and land-use change module. Andrew Holdaway, Indufor’s Geospatial Application Developer comments, “when we started developing the applications, we took care to understand how regional council experts would like to interact with satellite data and how best to support its use”.
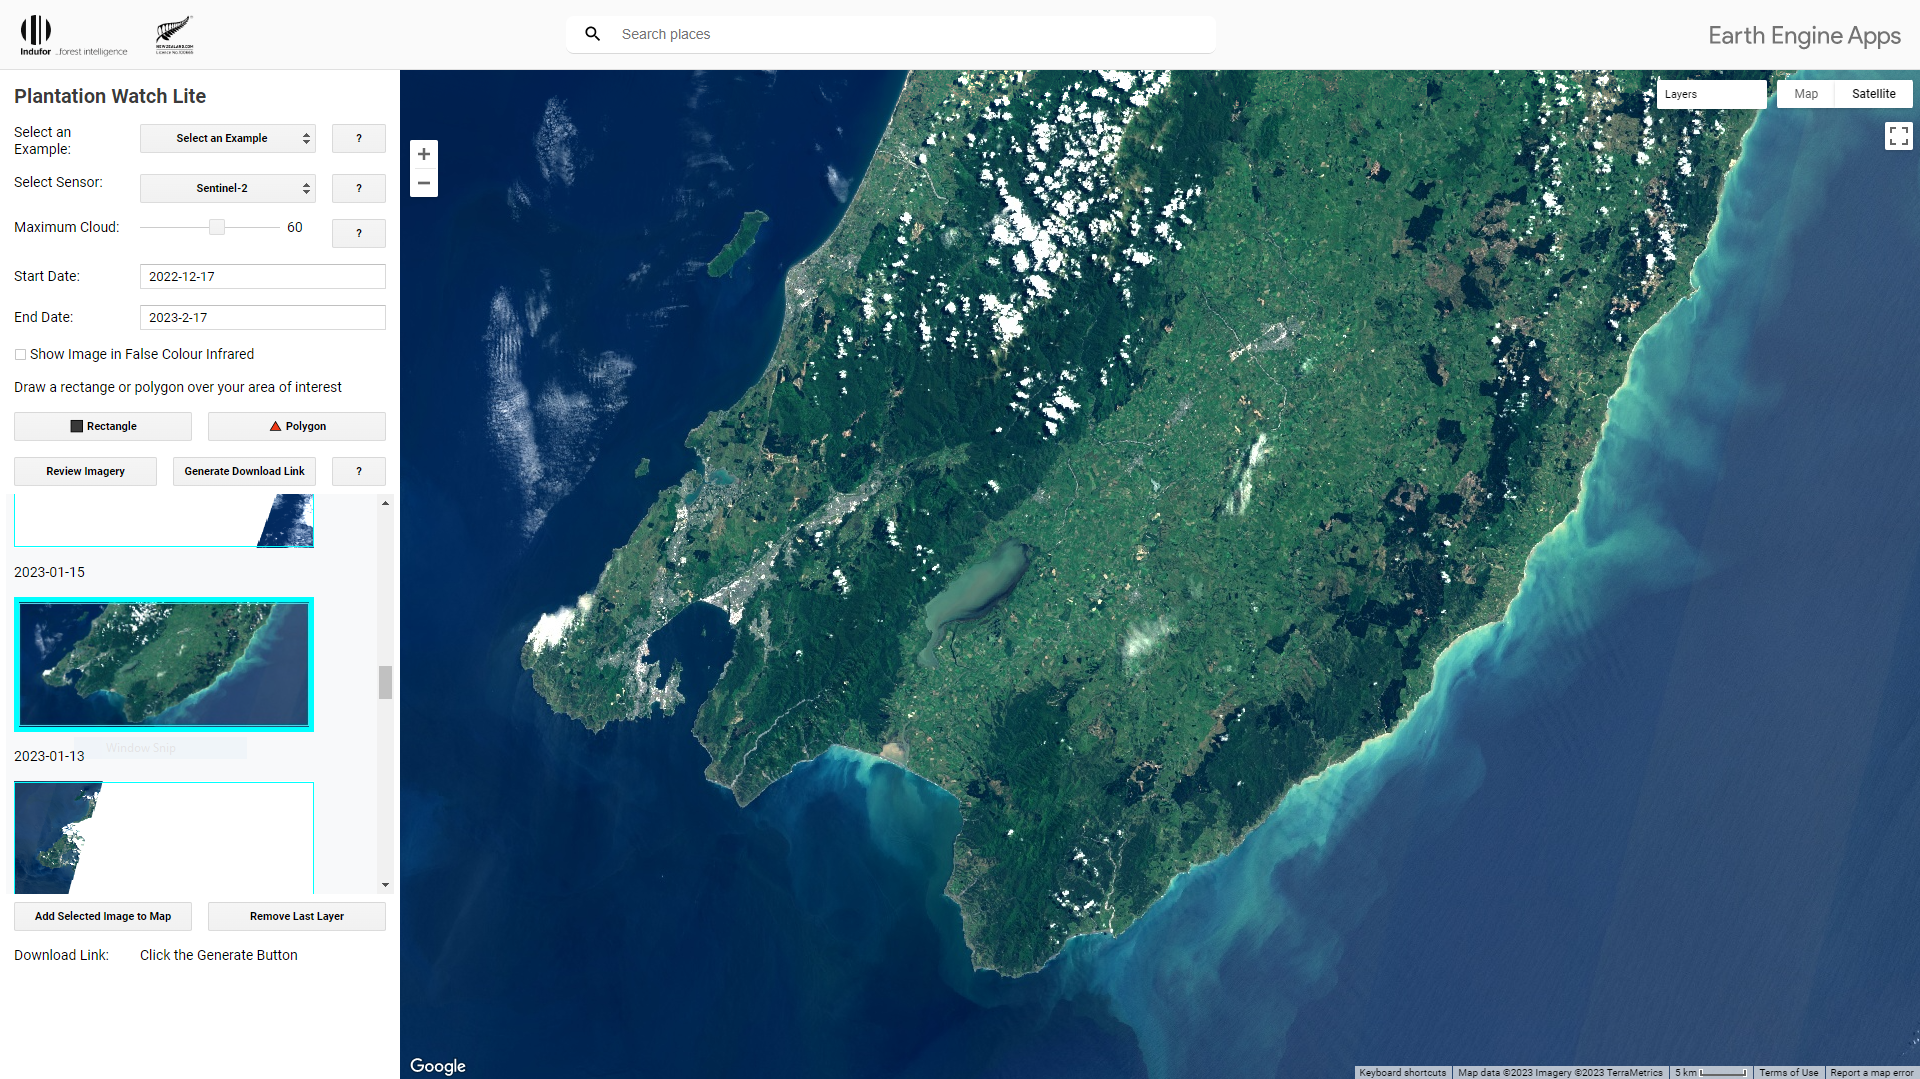
As an introduction, Indufor developed and released several demonstration applications. The first, a simple satellite image viewer to allow users to view and compare satellite images across landscapes.
Indufor’s Plantation Watch Lite: Sentinel-2 satellite image of Wairarapa, New Zealand.
Building from this point, Indufor released a land cover tracking application called Stand Tracker. The application analyses satellite images captured every five days in near real-time. Users can query these images over any location or time period to visualise changes in vegetation cover. In the example provided, we tracked vegetation and rainfall change between 2019 and 2023, where harvesting commenced in 2020.
The charts highlight temporal trends in the (green) vegetation index chart with the sharp decline associated with the start of harvesting. The (blue) rainfall chart shows the monthly rainfall pattern. While less informative in this example, rainfall data is often beneficial when explaining vegetation index trends across agricultural settings, i.e. the onset of drought conditions.
The demonstration applications provided a solid entry point for the scientists from various regional councils to engage in environmental monitoring. This work continues, with Indufor recently contracted to develop a regional monitoring framework. The intention is to streamline existing land cover monitoring processes by integrating Indufor’s ‘MO’ alerts system.
For information on our monitoring solutions, please visit our blog or contact us to discuss your monitoring needs.


