With the introduction of environmental policies and national environmental standards (NES) comes an increasing need to monitor changes across landscapes. The Freshwater NES set requirements for carrying out certain activities that pose risks to freshwater ecosystems. One of the intended outcomes of the NES is to improve the health of waterways by reducing sediment and nutrient runoff, improve streambank stability and improve habitat diversity.
On farms, specific actions include the fencing of waterways and limiting winter grazing to paddocks with less than 10° slope.
For many agencies, the task of compliance monitoring can be challenging and time-consuming with the only practical option to visit a small subset of areas. While satellite data itself may be too coarse to identify fence lines, high revisit sensors such as Planet and Sentinel-2 provide a means of tracking land-use change across catchments and along riparian margins.
To make use of such data, it first needs to be analysed and translated into actionable information. This process can be complicated for non-experts or those responsible for monitoring change. Often these challenges include accessing and processing such data to produce timely and understandable results.
Using the Waipā River catchment, which is known to be the largest contributor of sediment to the Waikato River, we demonstrate how Indufor’s monitoring framework identifies land cover change across river catchments efficiently.

The processing routine uses cloud filtering techniques to mine each image and extract only cloud-free pixels. The composites represent the clearest pixels from each period. To assist with profiling a change event, each pixel within the composite is assigned a change date.
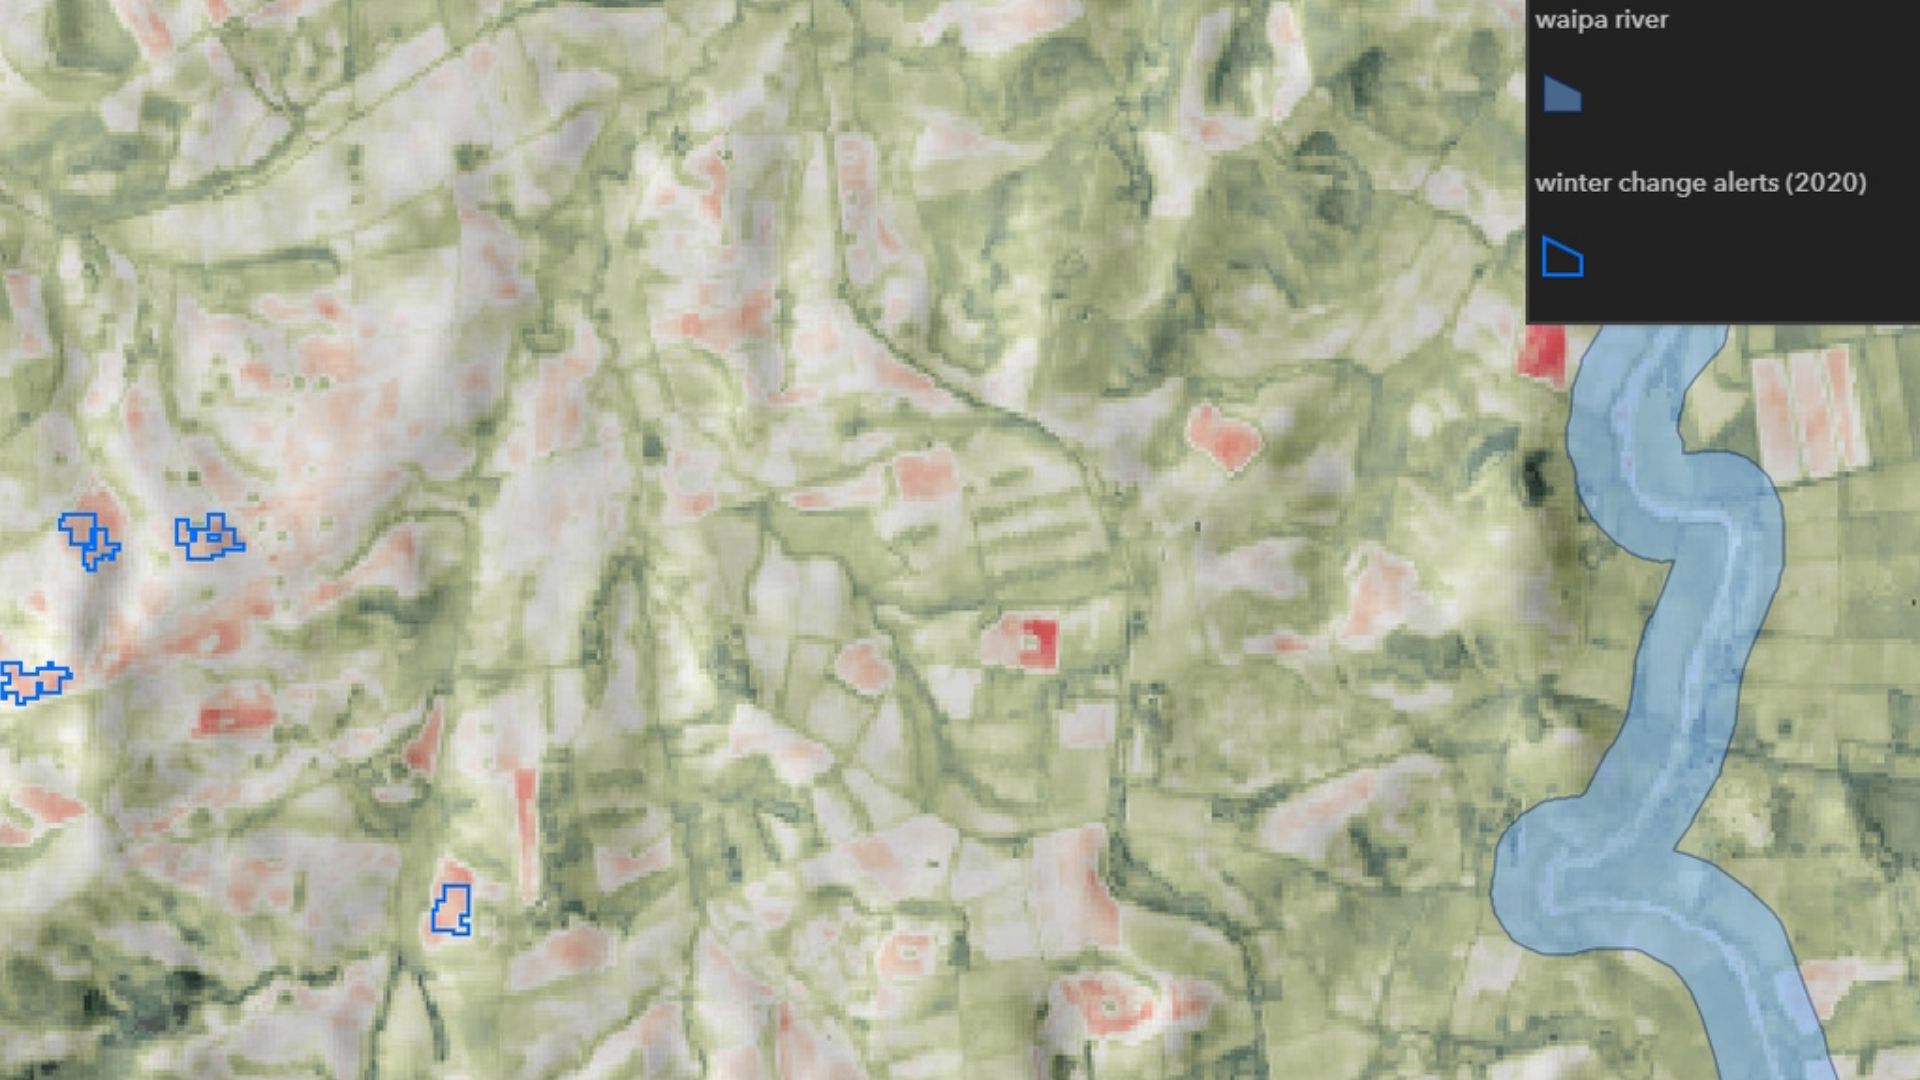
Within the catchment we first identify and map change in pasture cover between April to August 2020 by iterating through the Sentinel-2 image stack, which contained some 30 observations.
This process identified 98 change alerts ranging from 0.5 to 2.6 ha on land over 10° ground slope. Of the 98 alerts, 48 are within 100 m of a mapped stream (LINZ, NZ River Centrelines).
Given that land management across the catchment is continually changing, any processes that capture these dynamics can offer further insight as to the proximity to waterways, the area, frequency, and timing of the change.
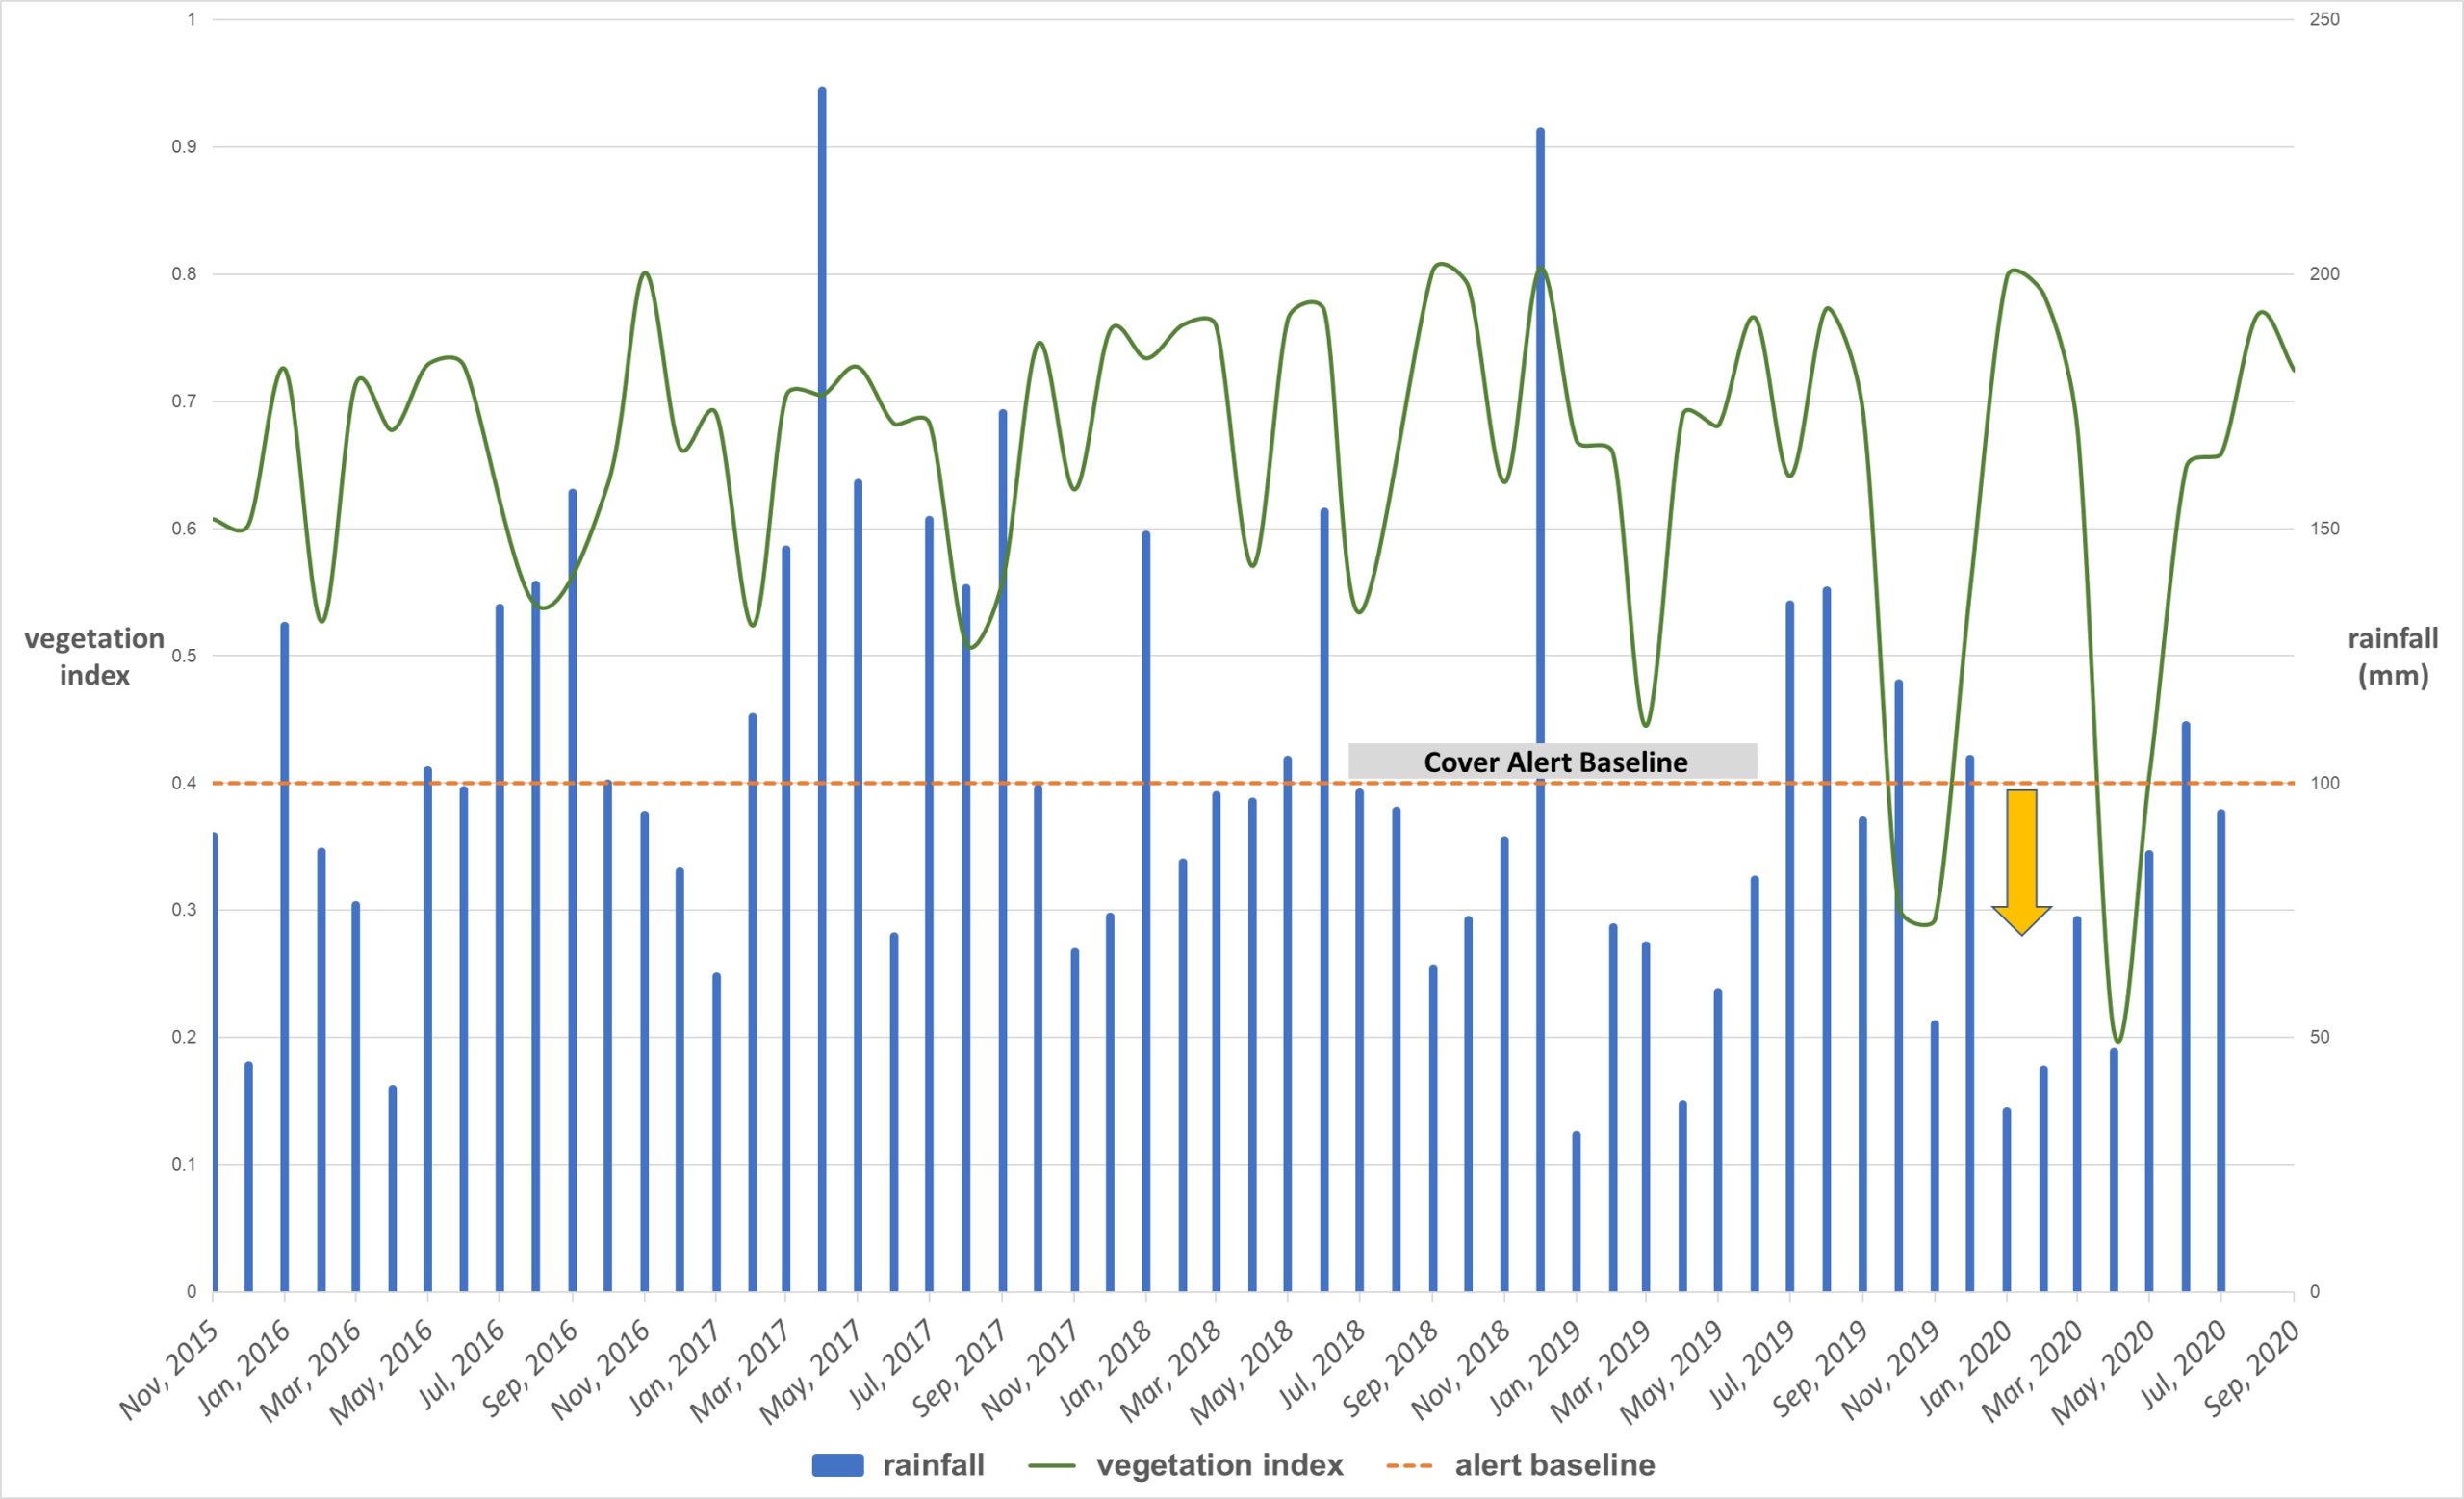
We achieve this by analysing a temporal stack of satellite images spanning from 2015 to 2020. The observations returned are filtered using the aforementioned cloud filtering techniques which exclude cloudy observations to give a temporal sequence that tracks changes in vegetation (index) over five years.
By way of example, the graph shown plots the change in the vegetation index (green line) from 2015 to 2020 for a single alert.

The inclusion of rainfall data (blue bars) assists in explaining patterns in seasonal growth and highlight the close correspondence between increases and decreases in the vegetation index and monthly rainfall. The dotted line plots a pre-selected alert threshold – alerts are generated as areas fall below this threshold.
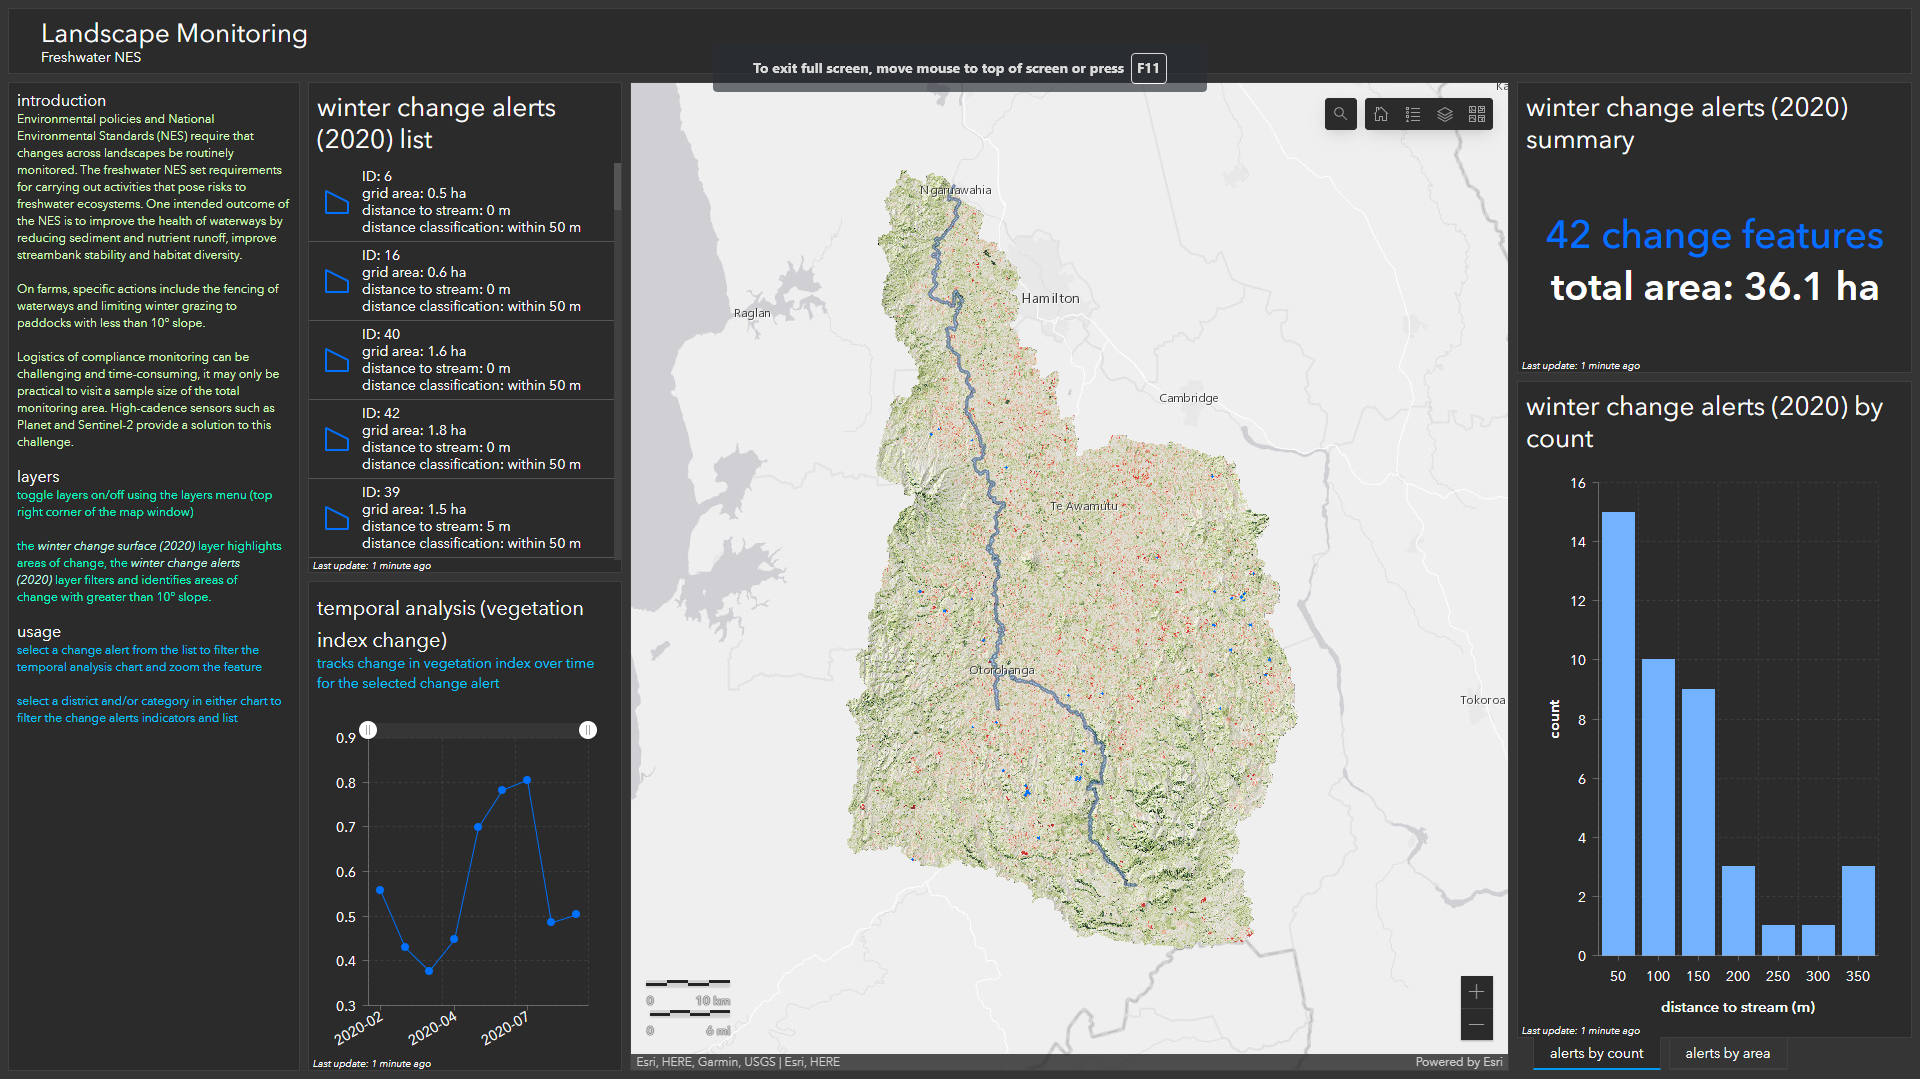
In general, a sharp decline in the index signals loss of pasture cover, i.e. due to either cultivation or intensive grazing activities. The final stage wraps up the backend analysis and presents the information as a series of spatial layers that can be downloaded or queried via an online dashboard. Click here or the image below to access the interactive dashboard (recommend viewing the dashboard using a tablet or larger device).
The desired outcome streamlines the monitoring process by eliminating the need for cumbersome manual image search and analysis. The methodology described provides a framework that enables land cover changes to be tracked and referenced against long term trends. The monitoring tools are designed to operate at the catchment level, and so offer an efficient way of understanding temporal changes across landscapes.
Such information assists landowners to demonstrate sustainable land management and those on the regulatory side such as policymakers and those tasked with compliance to measure the impact of the NES on land-use practices. Finally, the use of a Dashboard provides an easy way of sharing information between different agencies which further assists to target, plan and coordinate monitoring efforts.

